ProSim User Guide
Overview and information for our online simulation tool
Secure login URL: https://prismtc.co.uk/launchpad
Your trainer will provide you with the Course Code and Password required to access your course resources.
Click the desired scenario from the Launchpad, to launch the simulator in a new browser tab. This user guide uses our "Fermentation" scenario for its screenshots, so please note that your factors, responses and results will most likely be different.
- Background Information (where available) is predefined to provide scientific context to the delegates.
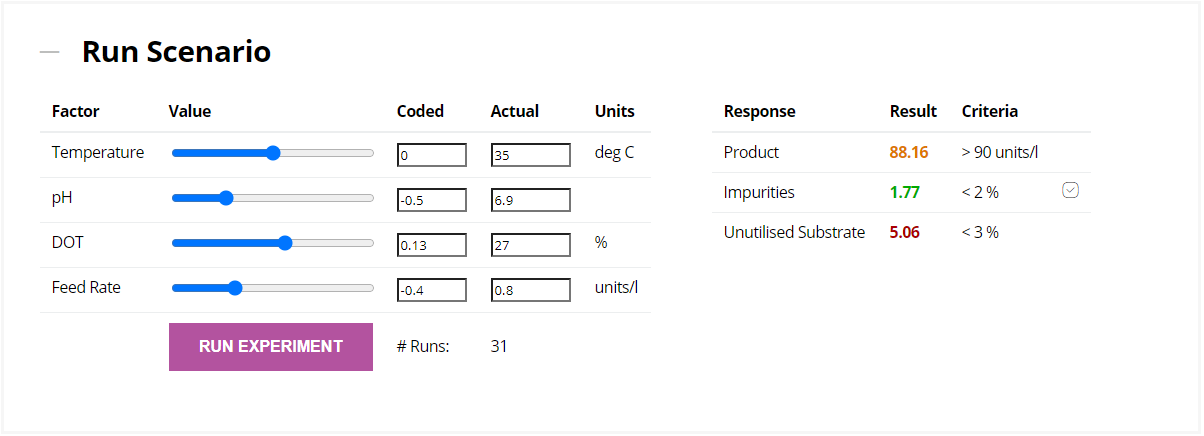
- Run Scenario allows the delegates to perform experiments, with the aim of identifying factor settings that allow every response to pass specification. Factors can be adjusted using the sliders, or by directly editing the coded or actual values:
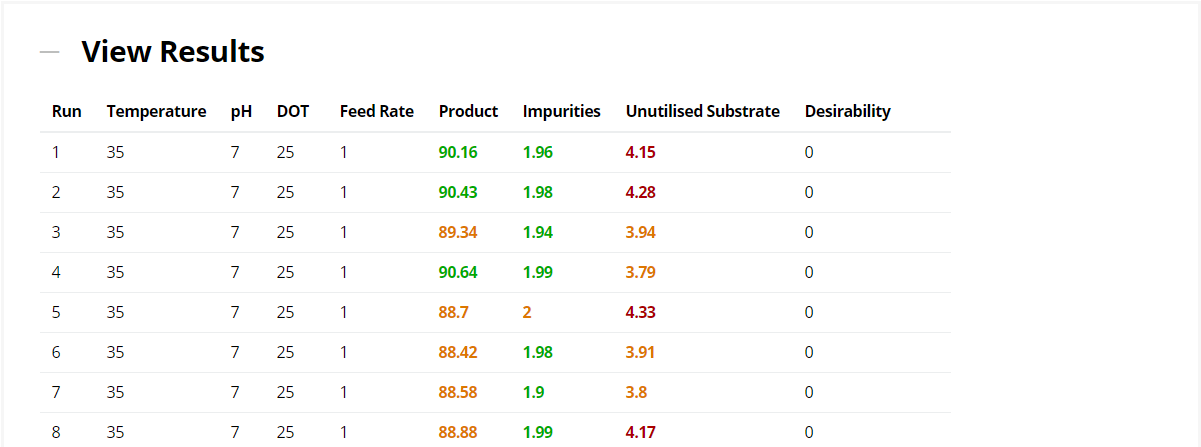
- View Results shows all the experiments that you have performed for the current scenario. Results are colour-coded by “pass / near / fail” status, and runs where all responses pass specification are flagged with a tick. A Desirability value is also calculated per run, and this is non-zero when all responses pass (please see General Notes below for further details). If you have found factor settings that produce a Desirability greater than zero, then the run with the highest Desirability is indicated by a star icon:
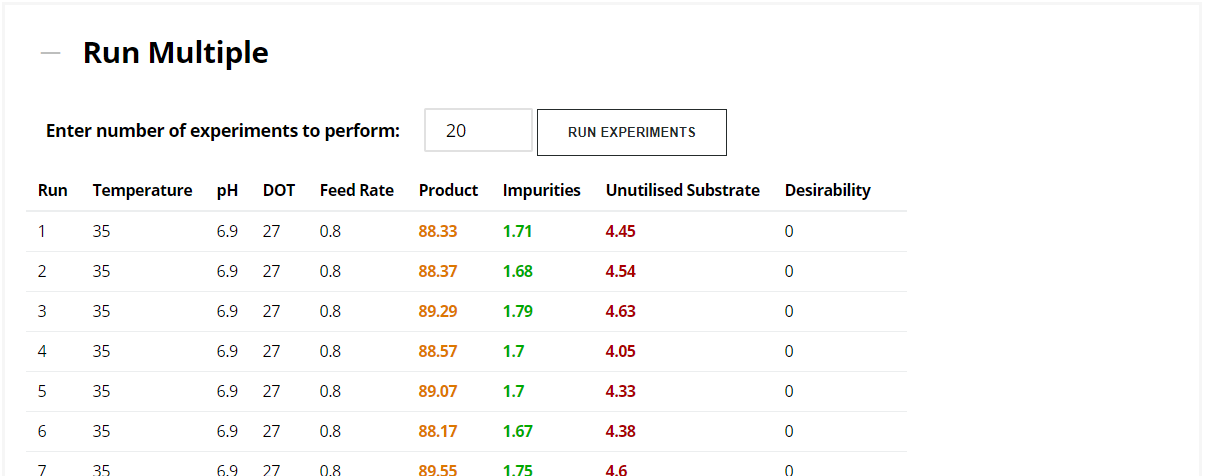
- Run Multiple allows multiple experiments to be performed, using the current Run Scenario factor settings:
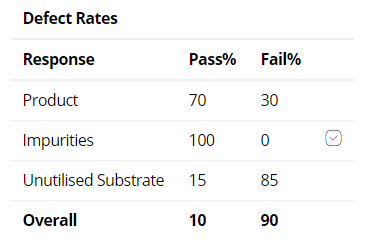
A “Defect Rates” table is provided below the results, showing the Pass% and Fail% results per response, as well as Overall (an Overall pass is where all responses pass simultaneously). This example shows that all Impurity results passed specification, whereas 85% of Unutilised Substrate results failed. Only 10% of the experiments (i.e. 2 of the 20 runs performed in this example) saw all three responses passing specification:
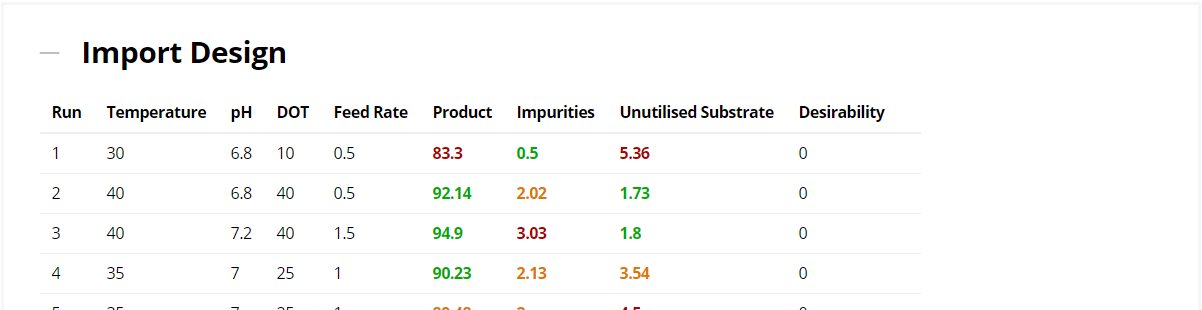
- Import Design is used to simulate results for a set of designed experiments, created in your chosen statistical software package. The runs must be pasted into the text area in the order specified:

Once simulated, the "Copy response data" or "Copy entire table" buttons can be used to copy the desired data to the clipboard, to paste back into your chosen statistical software package:
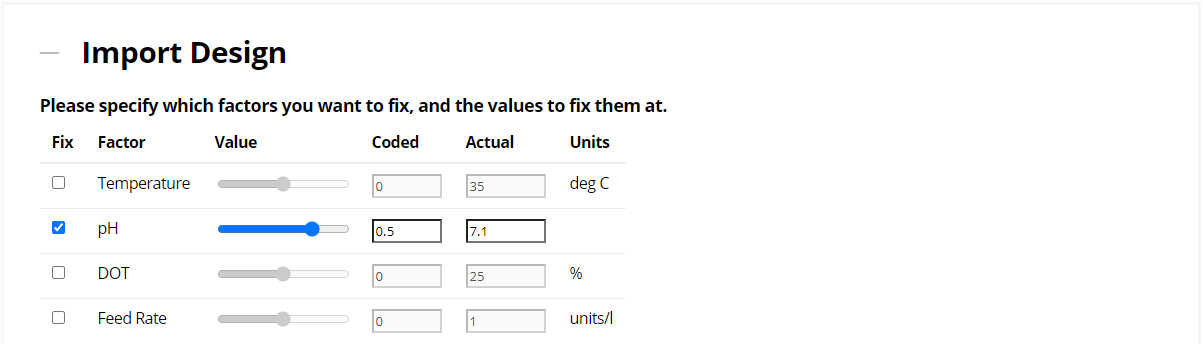
If any factors are to be fixed / dropped, do this via the “Fix Factors” button before pasting in the factor settings. In this example, pH is being fixed to a constant value of 7.1, so the simulator assumes that this value will not be pasted in as part of the designed study (i.e. only factor settings for Temperature, DOT and Feed Rate should be pasted in):
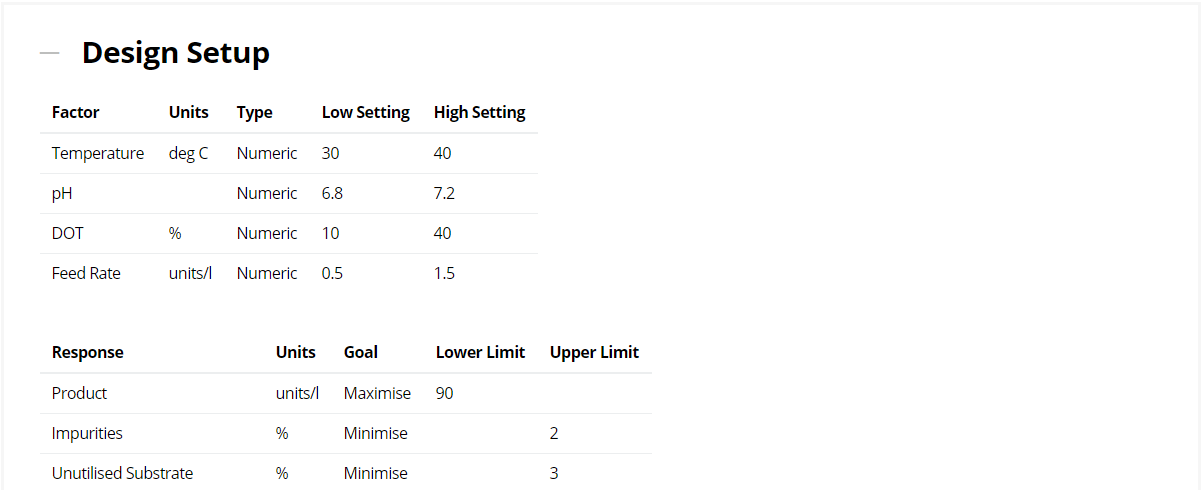
- Design Setup displays the factor ranges & response goals, to aid when creating a design in your chosen statistical software package:
User IDs, personal data protection & cookie information:
- All delegates are issued with the same Course Code and Password.
- Your User ID is automatically generated when you first log in via the Launchpad page. Your User ID (e.g. “User000”) is saved locally via a cookie, so that you retain the same ID throughout your training course. A second cookie is also created and stored, to instruct your browser to automatically log in during subsequent sessions.
- No personal data is stored by our tool; only our anonymous Course & Scenario IDs (e.g. “1234”) and your anonymous User ID (e.g. “User000”) are processed by our server. No IP address data (or any other data that may identify you) is retrieved or stored.
- All Run Scenario experiments that you perform are saved against your anonymous User ID, and our anonymous Course and Scenario IDs. This means that if you experience any technical issues (connectivity problems, browser crashes etc.), your previous runs will automatically be retrieved when you log in again.
General notes:
- Course Launchpads are available on a time-limited basis – after successfully logging in, the time remaining for the current course can be seen at the bottom of the Launchpad page. If a login is attempted outside the permitted date range, access will be denied.
- Desirability values are calculated using the geometric mean approach used by various statistical software packages (using the Max, Min and Target calculations listed here). All responses are assumed to have equal weighting and/or importance. (Note: if the goal is Maximise or Minimise, only the LSL or USL is specified. To calculate Desirability, a lower and upper value are required, so a nominal value is used for the “missing” spec).
- "Copy entire table" and "Copy response data" buttons are displayed when results are simulated under View Results, Run Multiple or Import Design. These copy the relevant data directly to the clipboard, allowing easy pasting into your chosen statistical software package for analysis and/or visualisation.
- To change to a different scenario, simply return to the Launchpad browser tab and click another scenario (multiple scenarios can be opened simultaneously)
We hope that ProSim will be a useful tool during your training course, and that this brief guide offers some helpful guidance.
If you have any questions on how to use ProSim, please ask your trainer or contact us here.