Interactive Training Tools
Discover our bespoke training tools, which allow our trainees to learn about the relevant statistical methods through interactivity and exploration!
Regardless of whether we deliver training in person or remotely, we design all of our training courses to be as interactive and relevant as possible. We’ve found that a great way to keep our trainees engaged is to provide purpose-built tools that let them “learn by doing” – this is far more enjoyable than boring them senseless with endless slides of statistical theory!!
To illustrate this, we’ve picked out a few of the tools that we use in our Effective DoE Implementation workshop – this is one of our most popular courses, in which we enable scientists, engineers, formulators, analysts etc. to apply some extremely powerful approaches to performing their experiments in the smartest way possible.
Please note that the animations shown below are fairly rapid; they are intended only to give an impression of each tool's functionality. In practice, our expert trainers would talk the trainees through each relevant part of the tools at a much gentler pace!
Learning Launchpad
Our trainees are provided access to our Learning Launchpad hub; this is a secure web-based portal, which we configure to provide easy access to the relevant workshop resources for each delegate:
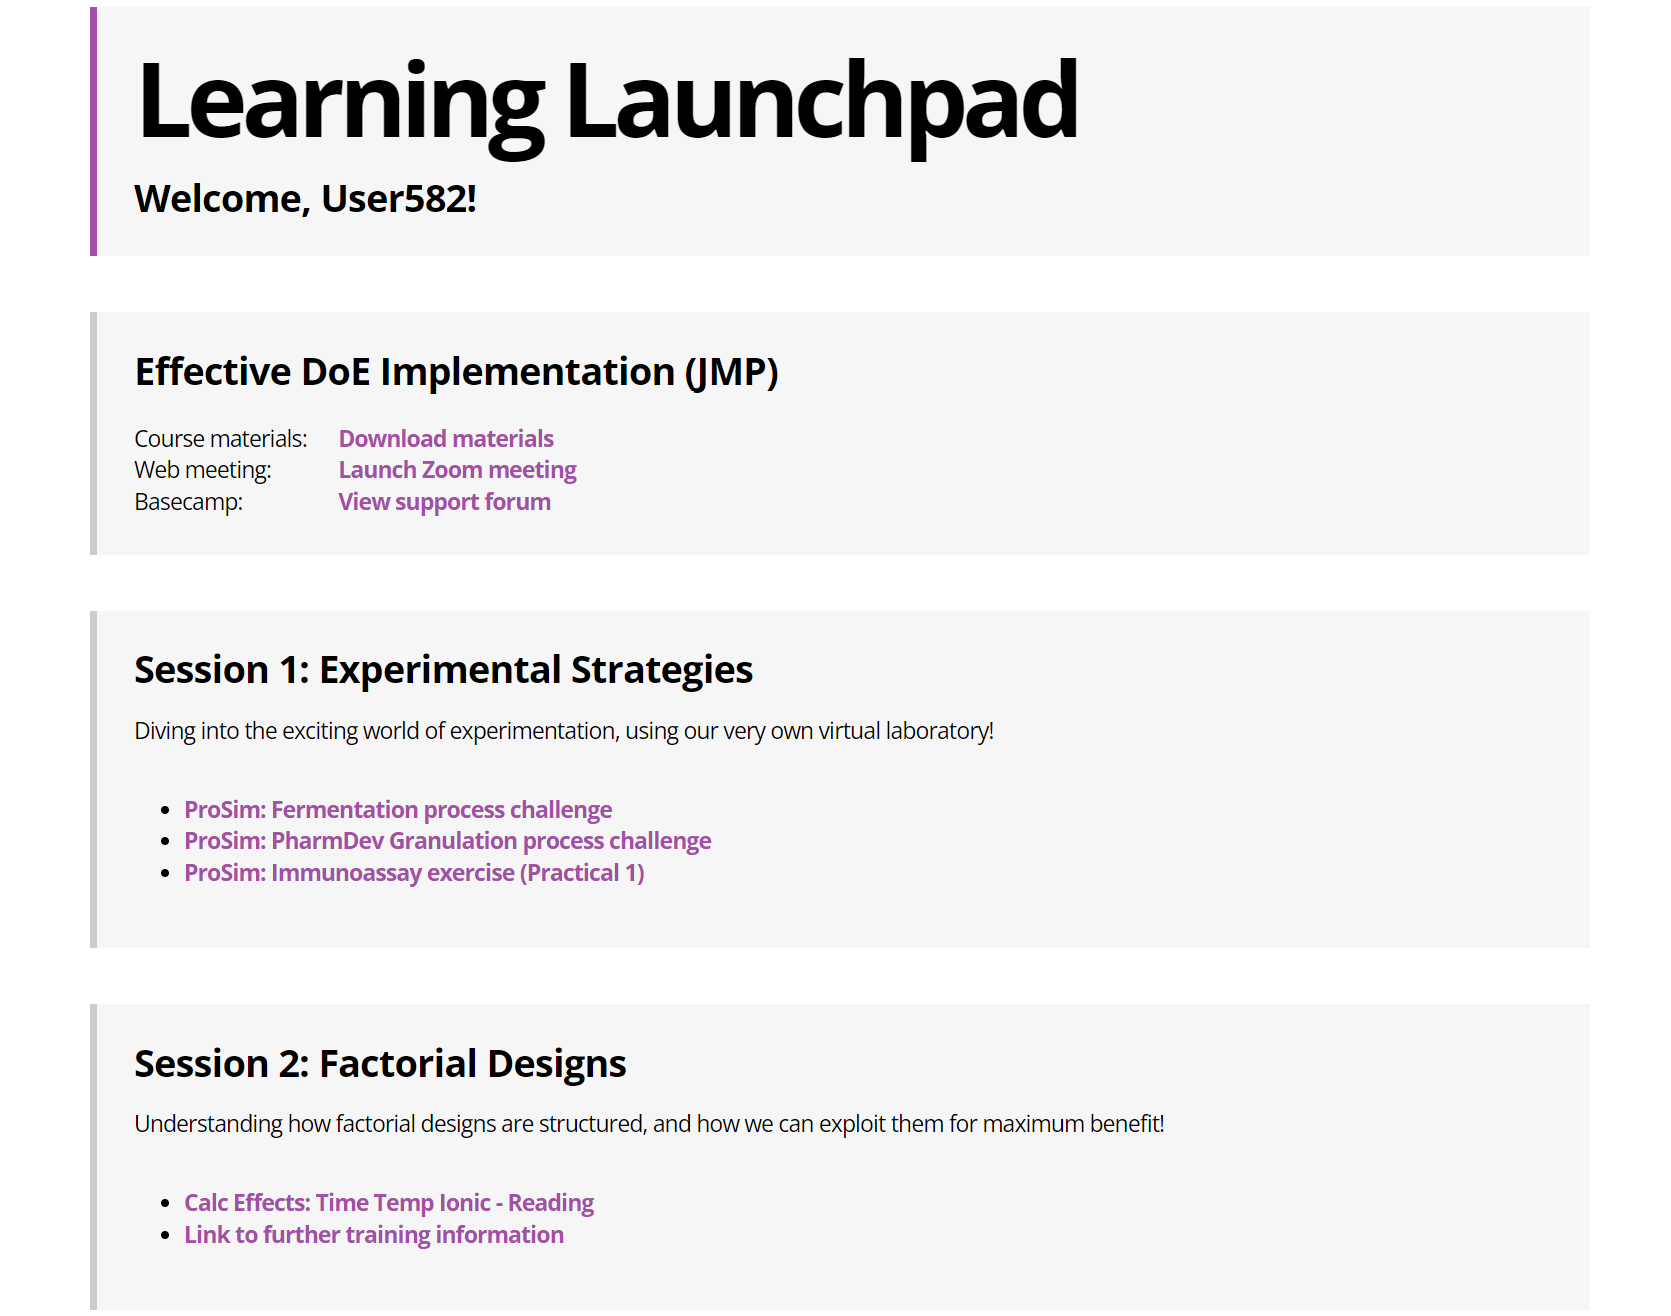
From the Launchpad, delegates can launch the various tools, as guided by their trainer. Each tool has been specifically developed to enhance the learning experience. As well as using the tools throughout the training sessions, we also provide access to the Launchpad after the course has finished, allowing the delegates to revisit any of the tools that they’d like to explore further.
ProSim
ProSim is a simulation tool that allows us to explore differing factor settings in the safety of our virtual laboratory:
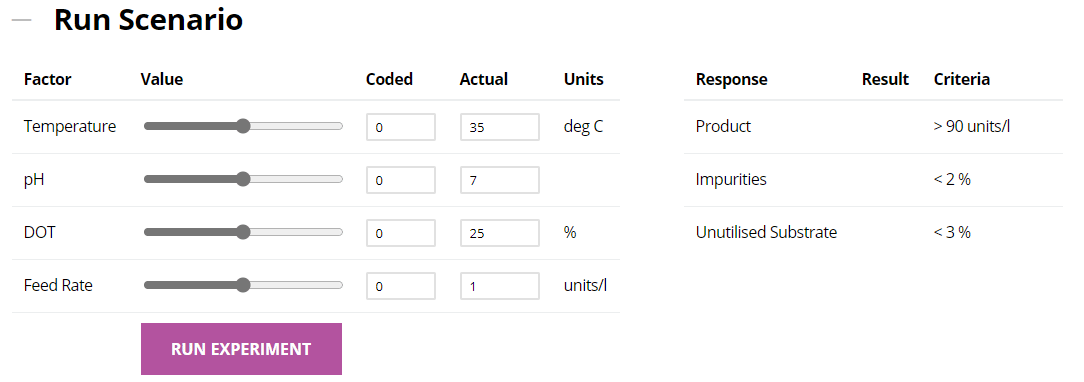
By using different scenarios taken from a variety of industries – from fermentation to laser welding! – our workshop attendees can interactively explore the relationships between the inputs and outputs of a particular process or assay, without the fear of wasting valuable resource. Designs can be imported into ProSim from our customer’s preferred software package to simulate results, allowing us to highlight the improved efficiency and effectiveness that is possible by adopting a more structured approach to experimentation.
Calculate Effects
We developed our interactive Calculate Effects tool to demonstrate the basic functionality of a Full Factorial design – far more interesting than the usual slides! We can load in any suitable scenario to visualise and explore the key features of these designs, as well as illustrating how the experimental results are used to estimate the chosen factors’ main effects and interactions. A trainer would describe how the design works, using the hands-on tool as a powerful visual aid:
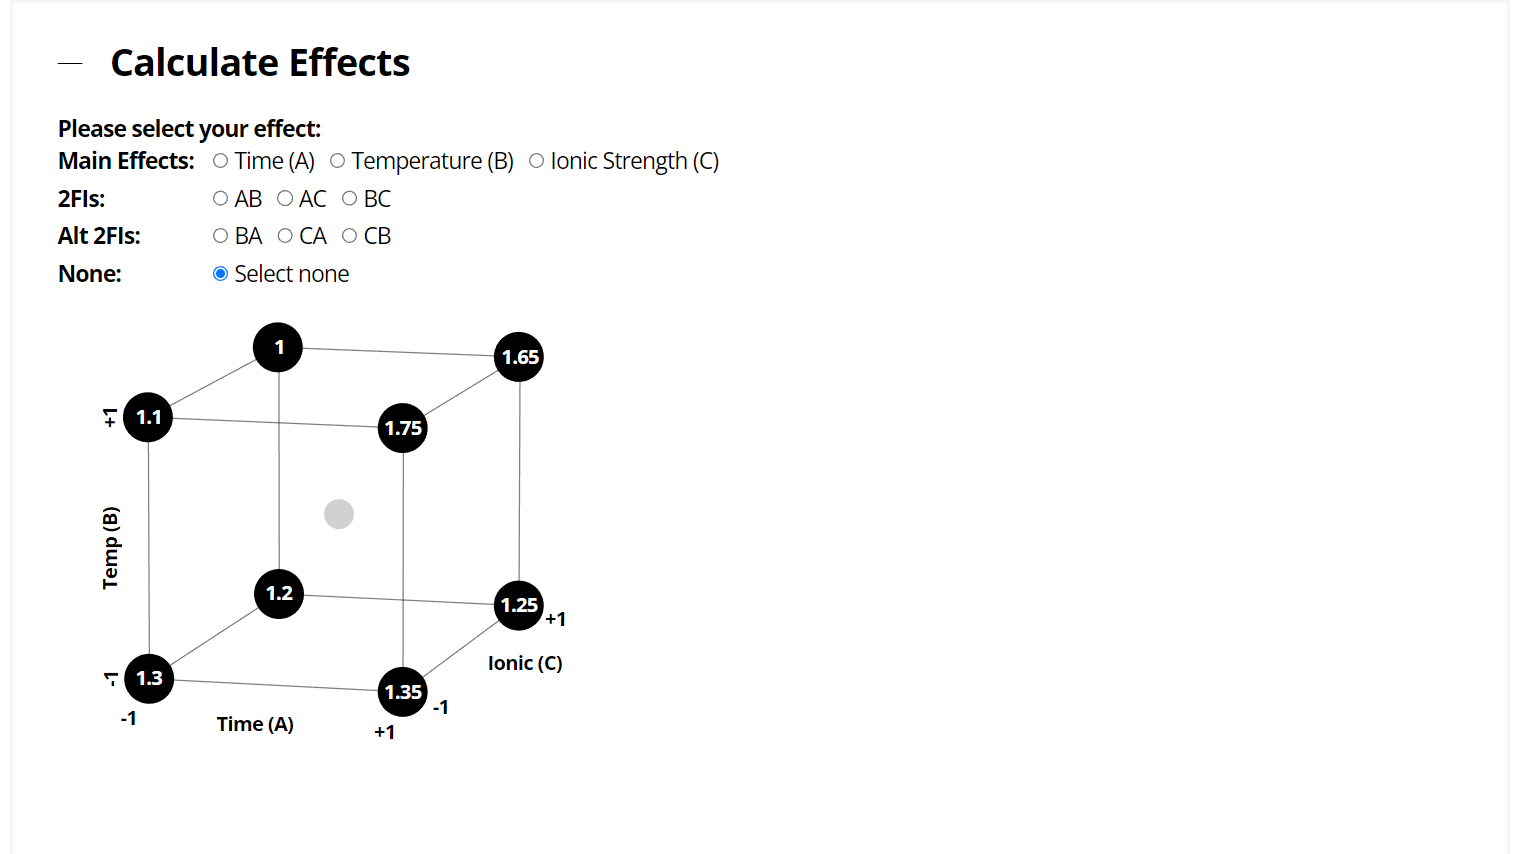
As well as allowing us to feature industry-specific case studies (or the client’s own data, if preferred), Calculate Effects is also designed to display the results in the style of various popular DoE software packages, ensuring that everything we cover is as directly applicable as possible.
RSM Explorer
RSM Explorer provides our trainees with a hands-on approach to understanding how classical Response Surface designs are constructed. Rather than getting bogged down in obscure-sounding statistical terms (“Spherical Axial values”, anyone?!?), we demonstrate what the various design choices look like – and discuss the practical implications of these choices.
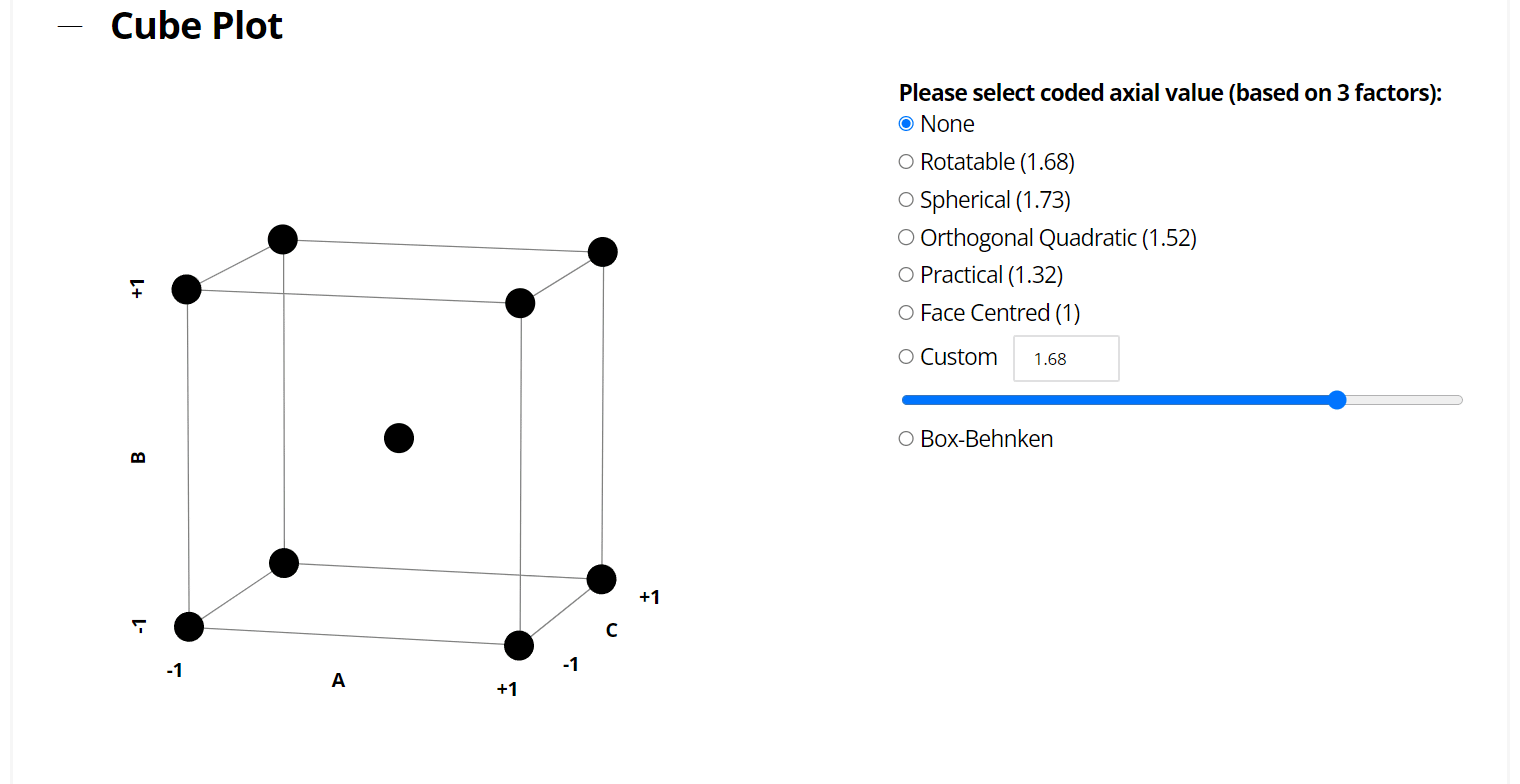
After exploring the pros and cons of Central Composite and Box-Behnken design features, the RSM Explorer tool then leads trainees through the statistical details – both in terms of the resulting Analysis of Variance (ANOVA) table, and also a commonly-used automated model reduction method. As with our other training tools, the statistical details are explained through interactivity, clear annotation and illustration.
Mixplorer
Some of our DoE training courses include a section on mixture designs, which are subtly yet crucially different to the “process” designs that the rest of the course focusses on. To visualise the key aspects of these unique designs, we use our Mixplorer tool to explain how the mixture space can be navigated, as well as how additional constraints can be introduced to the design:
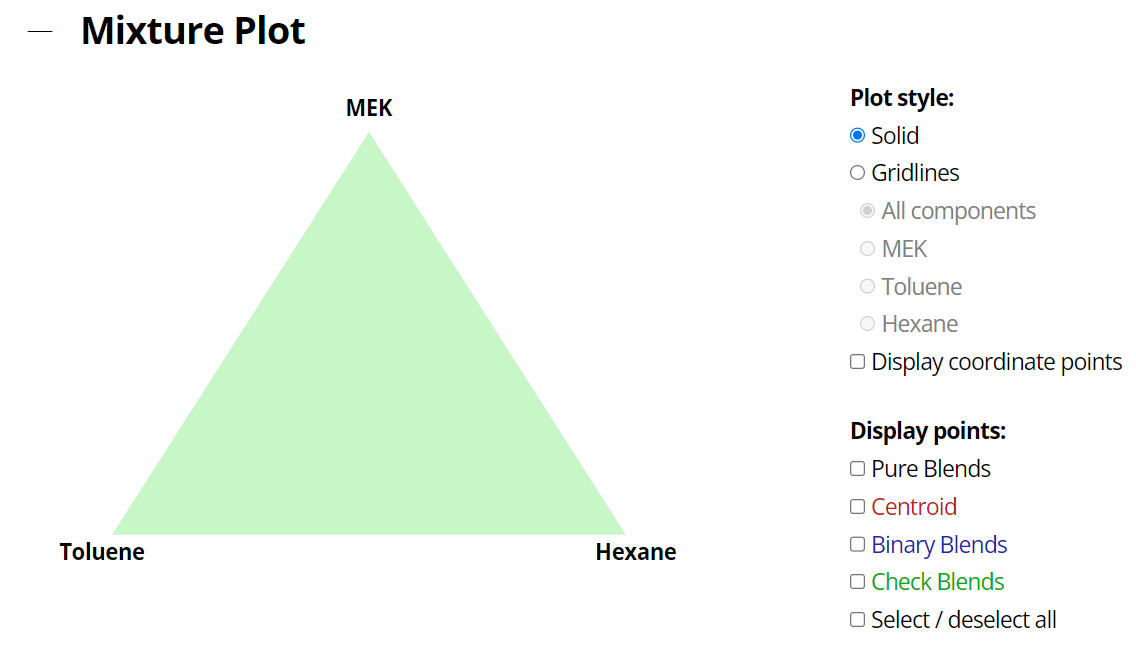
When designing a mixture study, some adjustments need to be made to the type of experiments performed, as well as the terminology used to describe them. Mixplorer offers a user-friendly way for our trainees to familiarise themselves with the quirks of these designs.
We hope that this overview of our approach to interactive learning is useful; for more general information on our training, take a look at our Training FAQs.
If you have any queries about any of the tools mentioned above, or if you're interested in attending one of our superb training courses, then please don't hesitate to contact us.
Please note that we can also incorporate client data into any of the tools shown above, allowing us to create bespoke case studies for company-specific interactive workshops.