Article: The Sequential Nature of Classical Design of Experiments
Part one of a series of three articles titled Practical (Real-life) Implementation of Sequential Design of Experiments and the Introduction of Definitive Screening Designs
Written by Dr. Paul Nelson, Technical Director.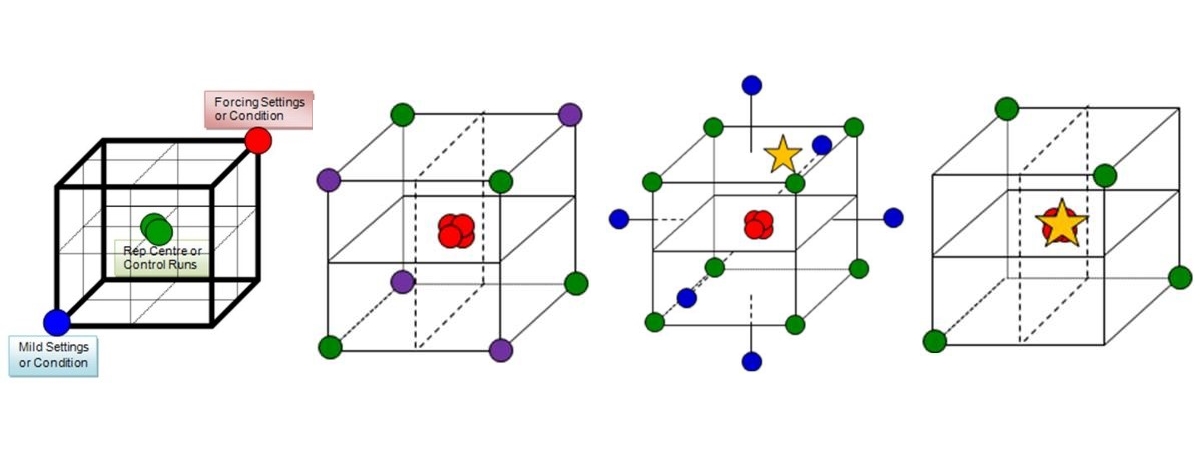
“To consult the statistician after an experiment is finished is often merely to ask him to conduct a post mortem examination. He can perhaps say what the experiment died of.” R.A Fisher (Mahalanobis, 1938)
A key objective of chemical, pharmaceutical and biopharmaceutical development and manufacture, is to deliver robust optimal and scalable processes capable of consistent and reproducible manufacture of medicines that conform to quality and manufacturing requirements, defined in the Quality Target Product Profile (QTPP), while meeting aggressive time schedules. The consequences and costs of nonconformities to a pharmaceutical company can be severe. The regulators recognised that to routinely ensure pre-defined quality and manufacturability, the focus needs to be shifted away from testing the product to designing quality into the process itself (i.e., Quality by design or QbD for short).
Implementing a QbD framework relies heavily on detailed process understanding and subsequently controlling the variation of key, or even critical to quality or manufacturing process parameters. One key tool to help achieve this aim is Design of Experiments (DoE). DoE is an established, proven resource-efficient methodology for informed product and process understanding leading to improvement, validation, control and continued process verification. It can provide a rational, data driven systematic and sequential workflow, involving changing many controllable parameters to understand their relationships with and direct their effects on the responses, or product attributes, to move these toward their desired robust optimal levels.
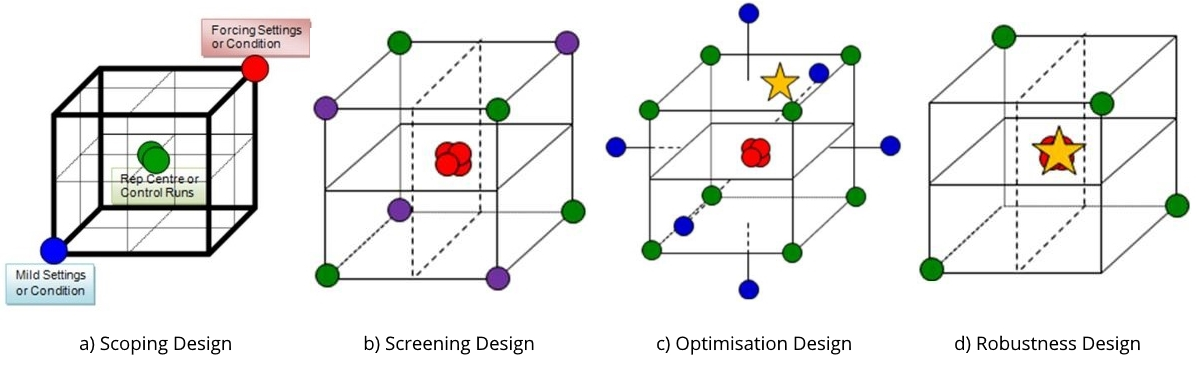
There are many types of experimental design that can be applied throughout the workflow to establish and control the critical process parameters. A CPP workflow, if you will. The choices of design should be fit for their intended purpose, like an analytical or assay method to perform a particular analysis. This purpose will depend on where you currently are within a workflow; the aims of the study; knowledge acquired from previous work carried out; and on the resources available. For instance, having arrived at a prioritised list of parameters to investigate, a small carefully chosen scoping design would generate data to provide confidence (or otherwise) in the proposed parameters under investigation; their ranges; and the reproducibility of the process or measurement system. A screening design can then be used to filter the vital few parameters affecting the process from the many tested, while an optimisation design generates more detailed understanding of the cause and effect relationships between these key parameters and the process attributes. The resulting models at this stage can be used to predict the most favourable conditions and establish predicted acceptable ranges, worst case conditions or edge of failure boundaries, and ultimately a risk assessed design space within which to successfully operate the process. To prove the ranges are acceptable and define a design space in which to routinely operate the process, a robustness design should be performed. This will demonstrate that the process is able to result in product conforming to requirements, even when the parameters are deliberately varied across their defined operating ranges or boundary conditions.
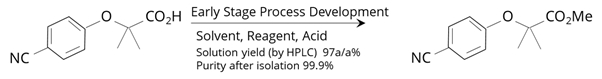
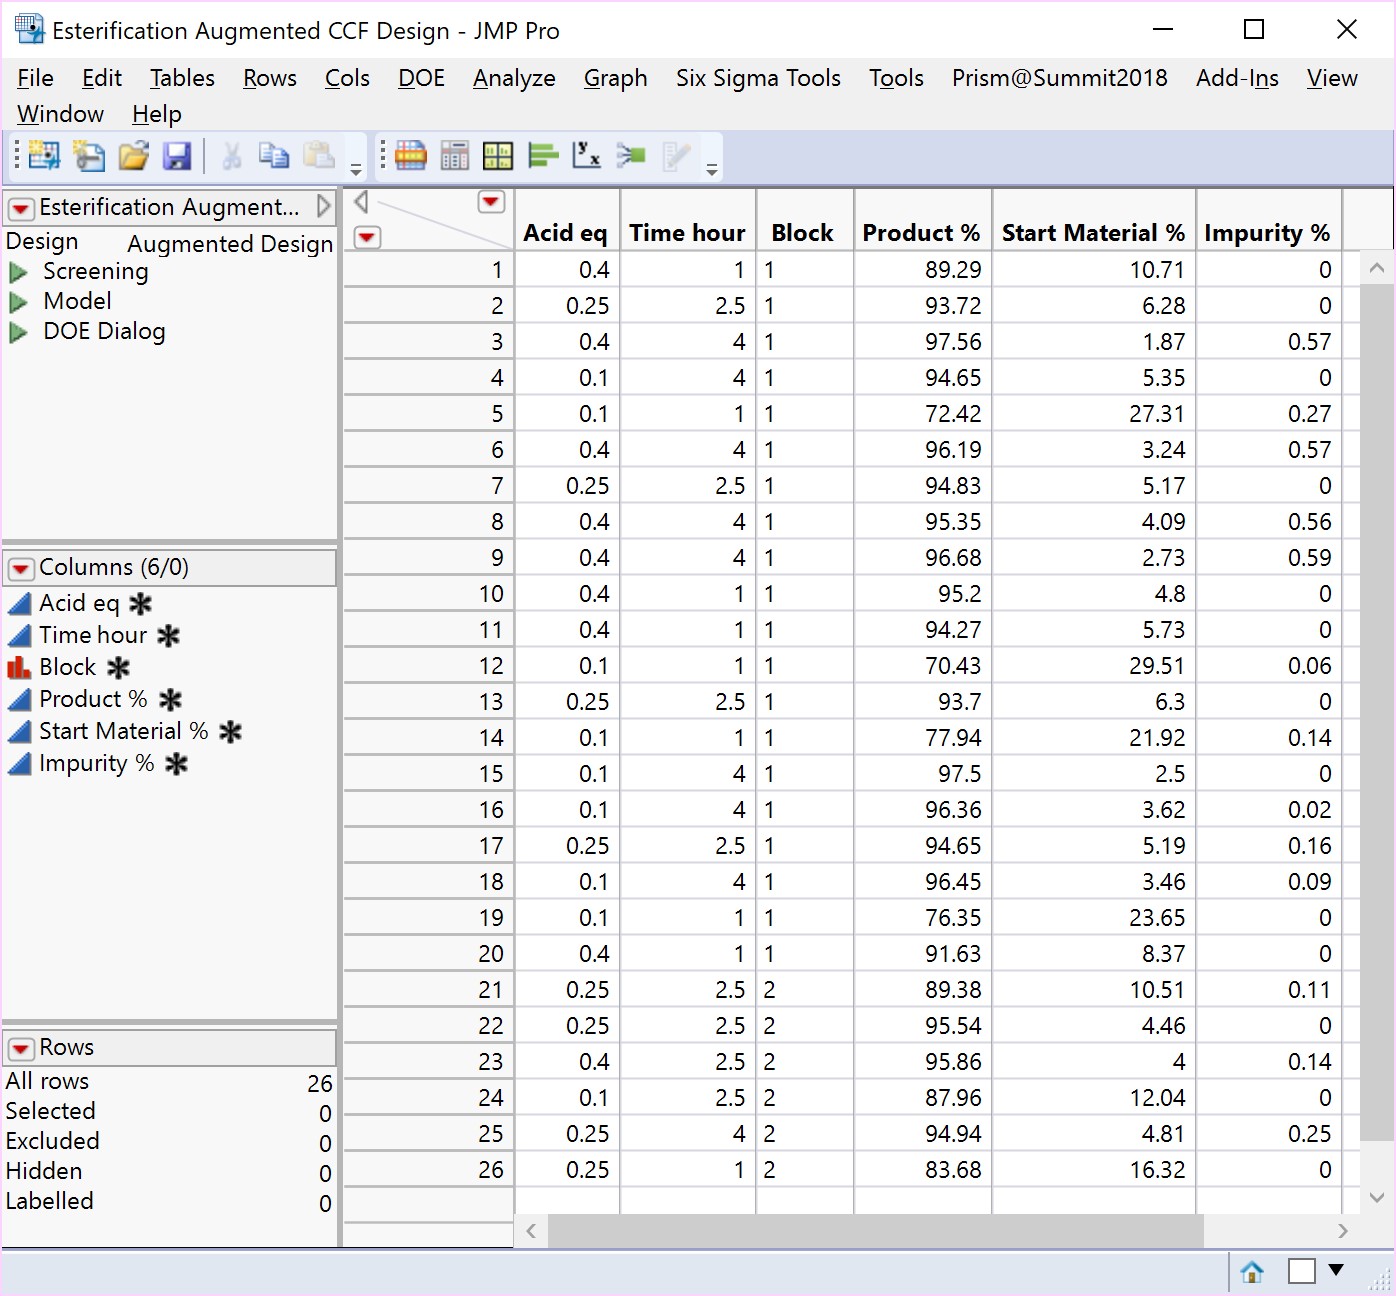
A first case study from chemical development is presented to illustrate in more detail how DoE can be successfully integrated into the activities of a QbD CPP workflow. The early stage development of an active pharmaceutical ingredient involves the esterification of an acid by the chosen synthetic route involving a reagent, acid and solvent together with reaction temperature, time and the spiking of an amount of water to determine whether the reaction is sensitive to residual water, due to incomplete drying from a previous stage. The reaction scheme is presented below.
Stated high in-process yield and purity following isolation masks a lack of process robustness. The project team routinely observe drops in isolated yield of up to 30%, accompanying changes to the set point conditions but within normal operating ranges.
What can we learn to explain the apparent lack of robustness by sequentially applying the four designs, or work packages, appearing in Figure 1 above. To sequentially develop, improve and continually refine our process understanding and model, we run:
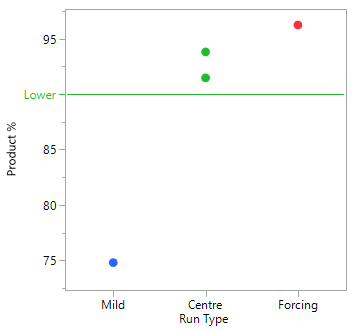
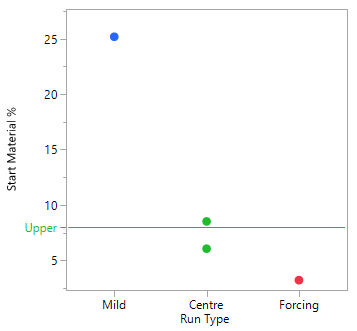
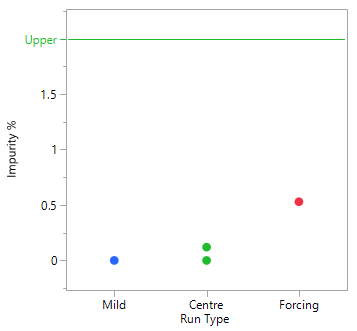
A Scoping Study, comprising just 4 experiments, helps to determine that the mid to more forcing conditions of all six process parameters under consideration, are likely to meet the target acceptance criteria. The mild settings of the six parameters however, resulted in yield dropping by the order of magnitude concerning the project team and poor conversion. The results of this small study simply reinforce that this is a process rather than an isolation problem. The repeat centre point results suggest good reproducibility (signal-to-noise) run-to-run, as well as curvature inside the experimental space (i.e., we are likely to be over an optimum). To set up your own Scoping Study, please try out our free online Scoping Design Builder tool.
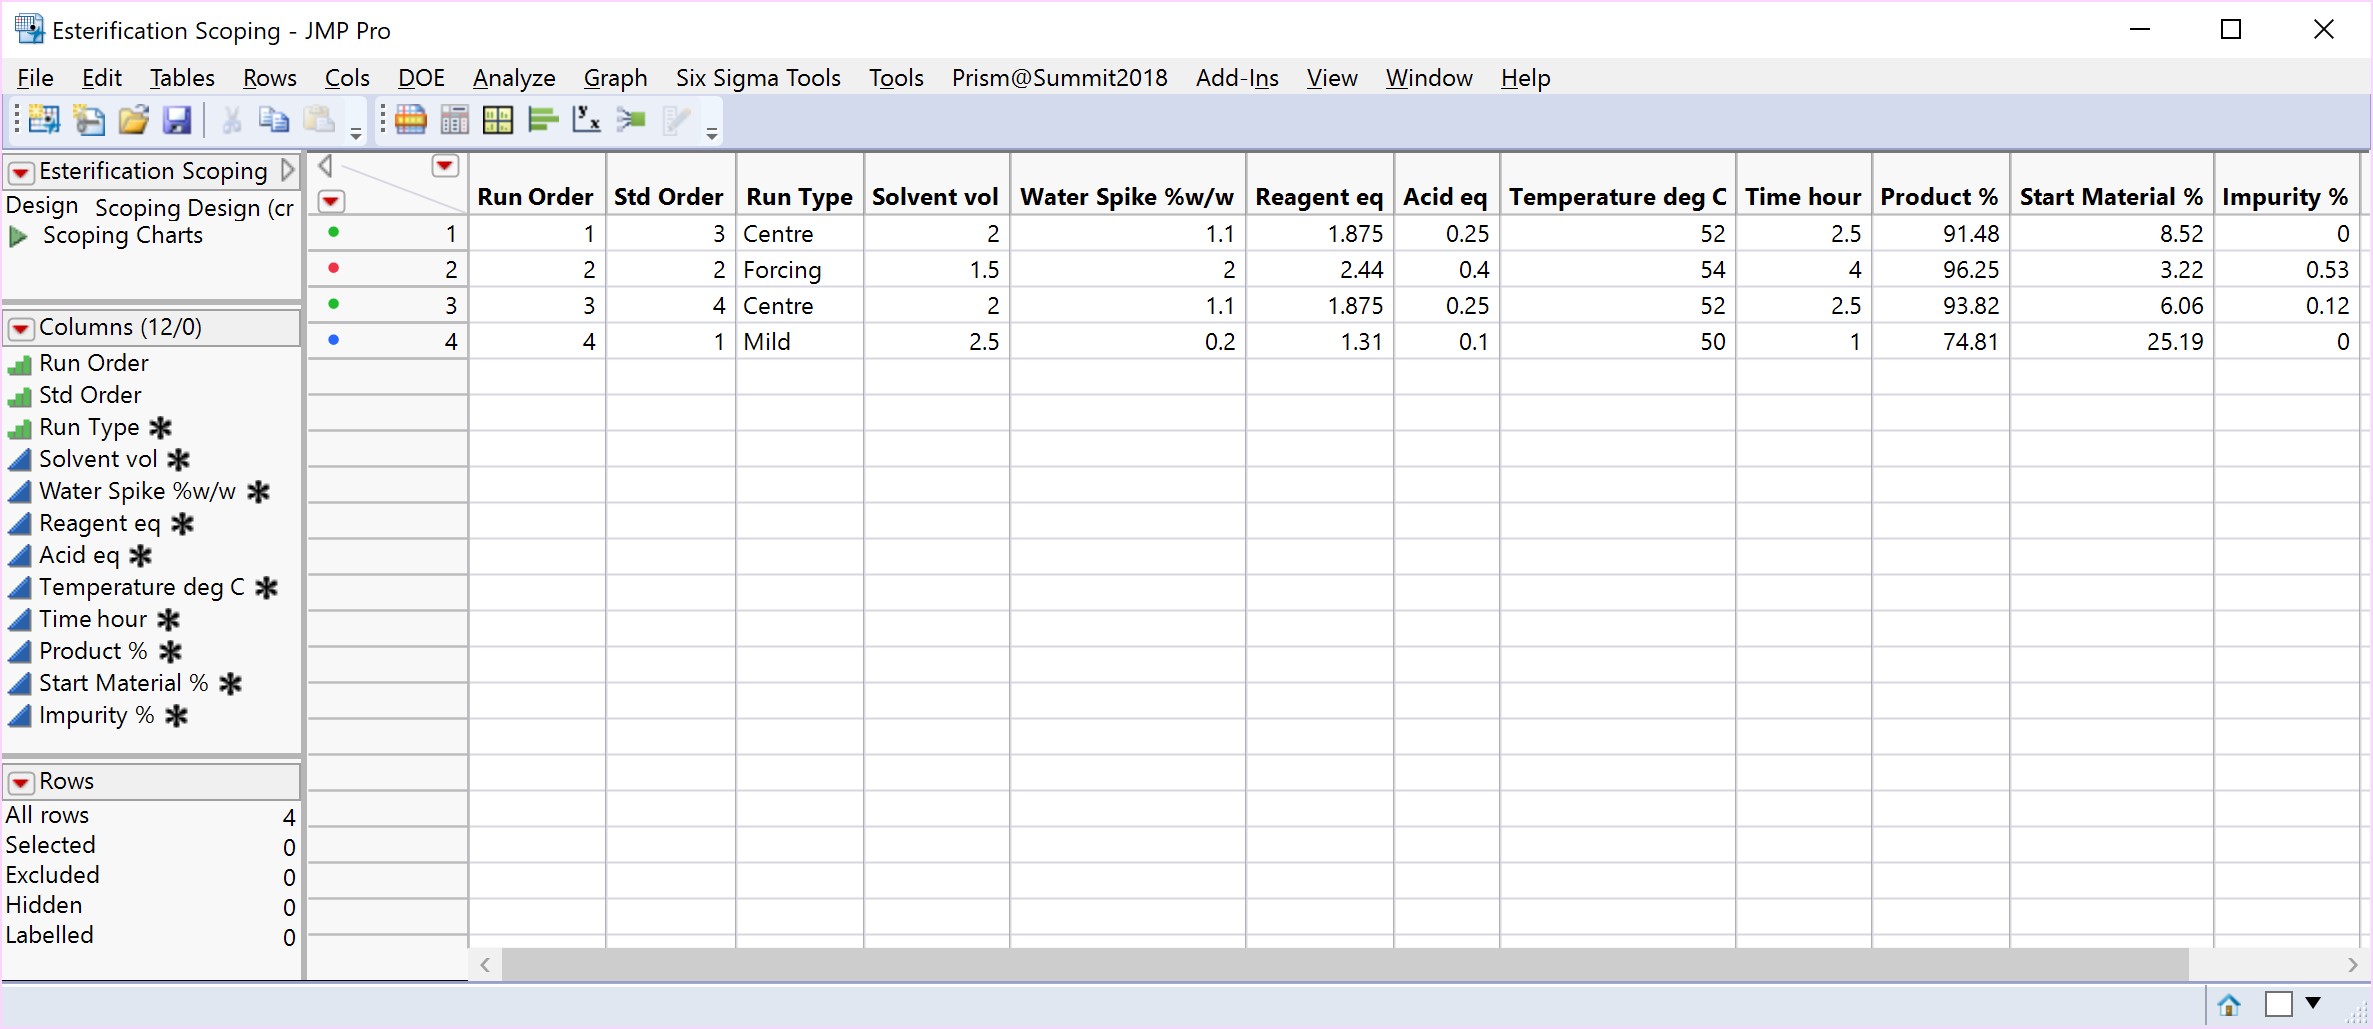
JMP® statistical software from SAS Institute Inc. is used throughout this article to illustrate the benefits of implementing a DoE and a broader QbD strategy. Our company, Prism Training & Consultancy Ltd are proud to be a certified JMP Partner, as well as the official re-sellers of Design-Expert® software for the UK and Ireland.
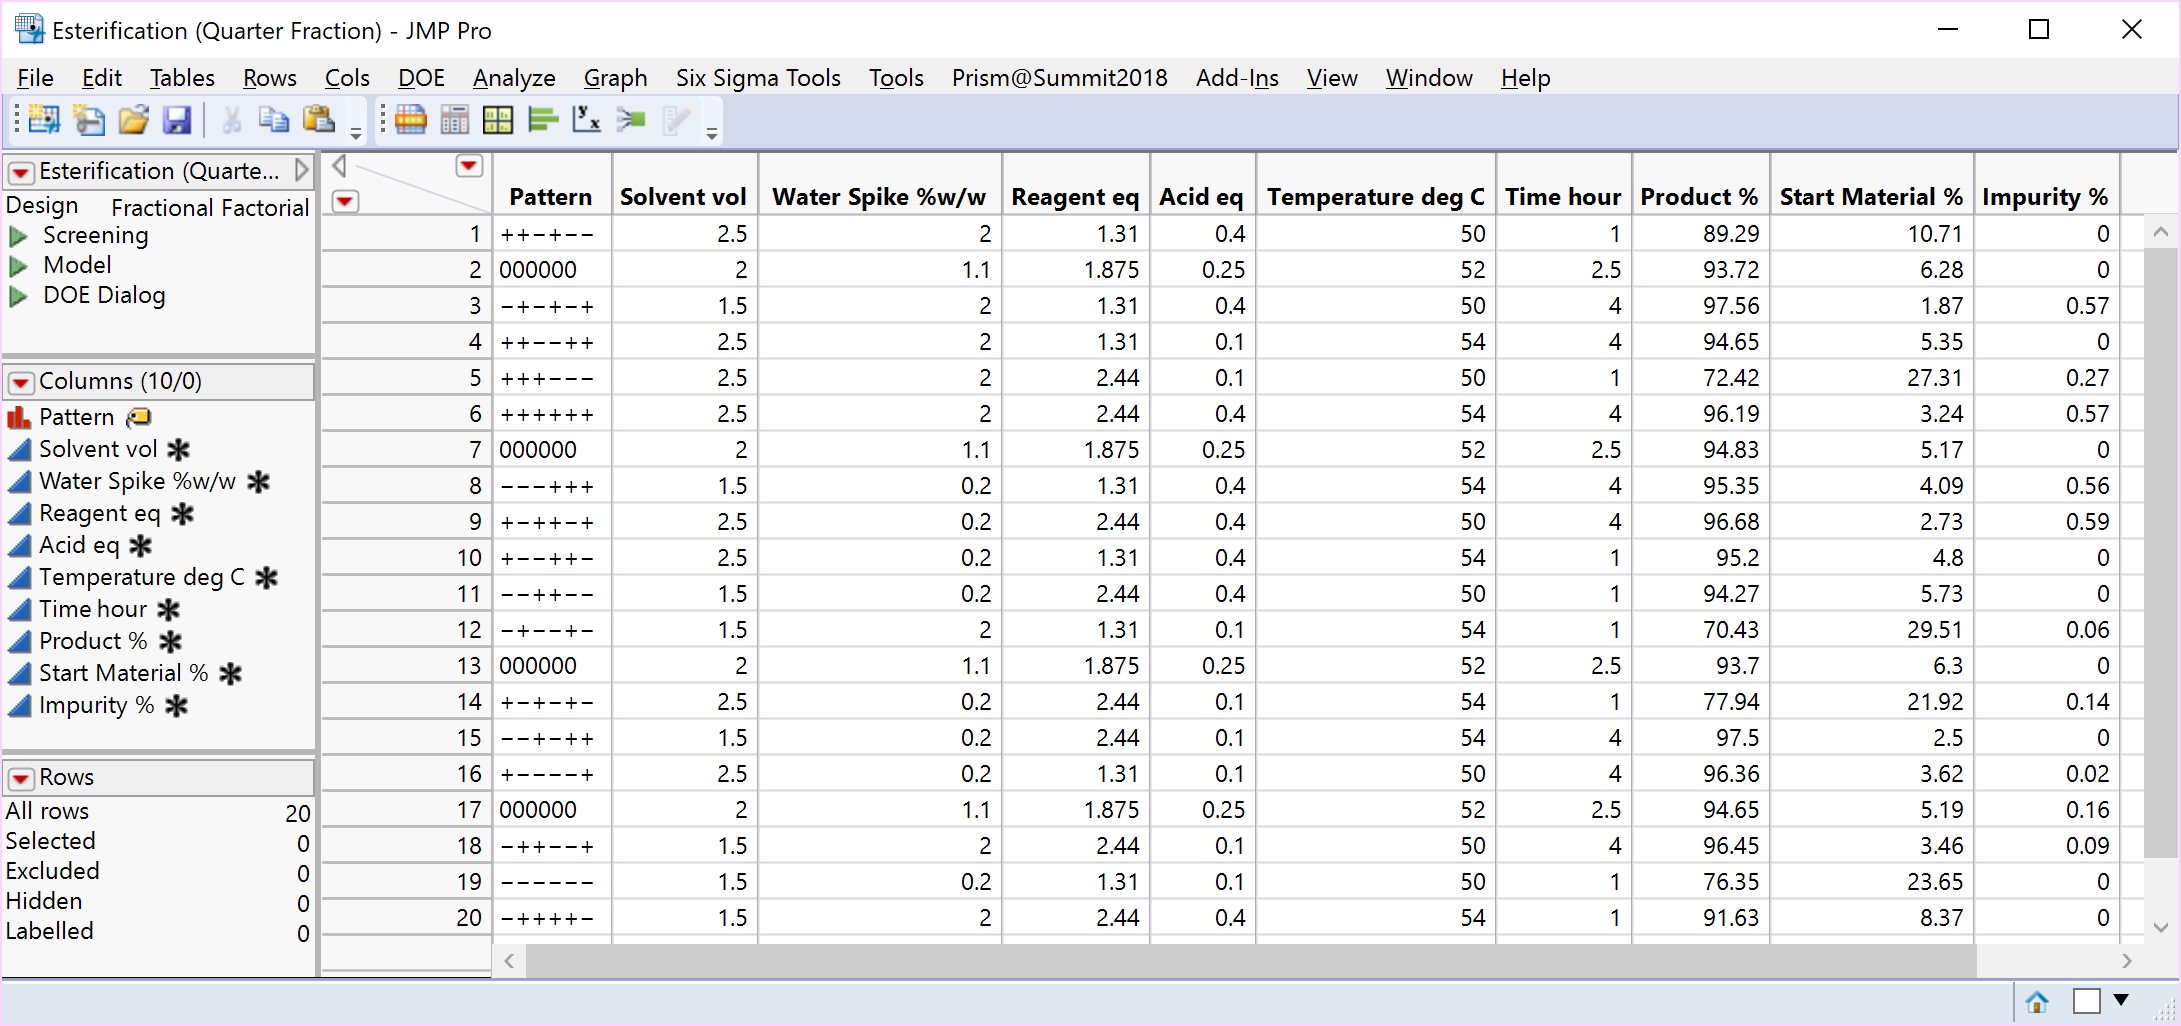
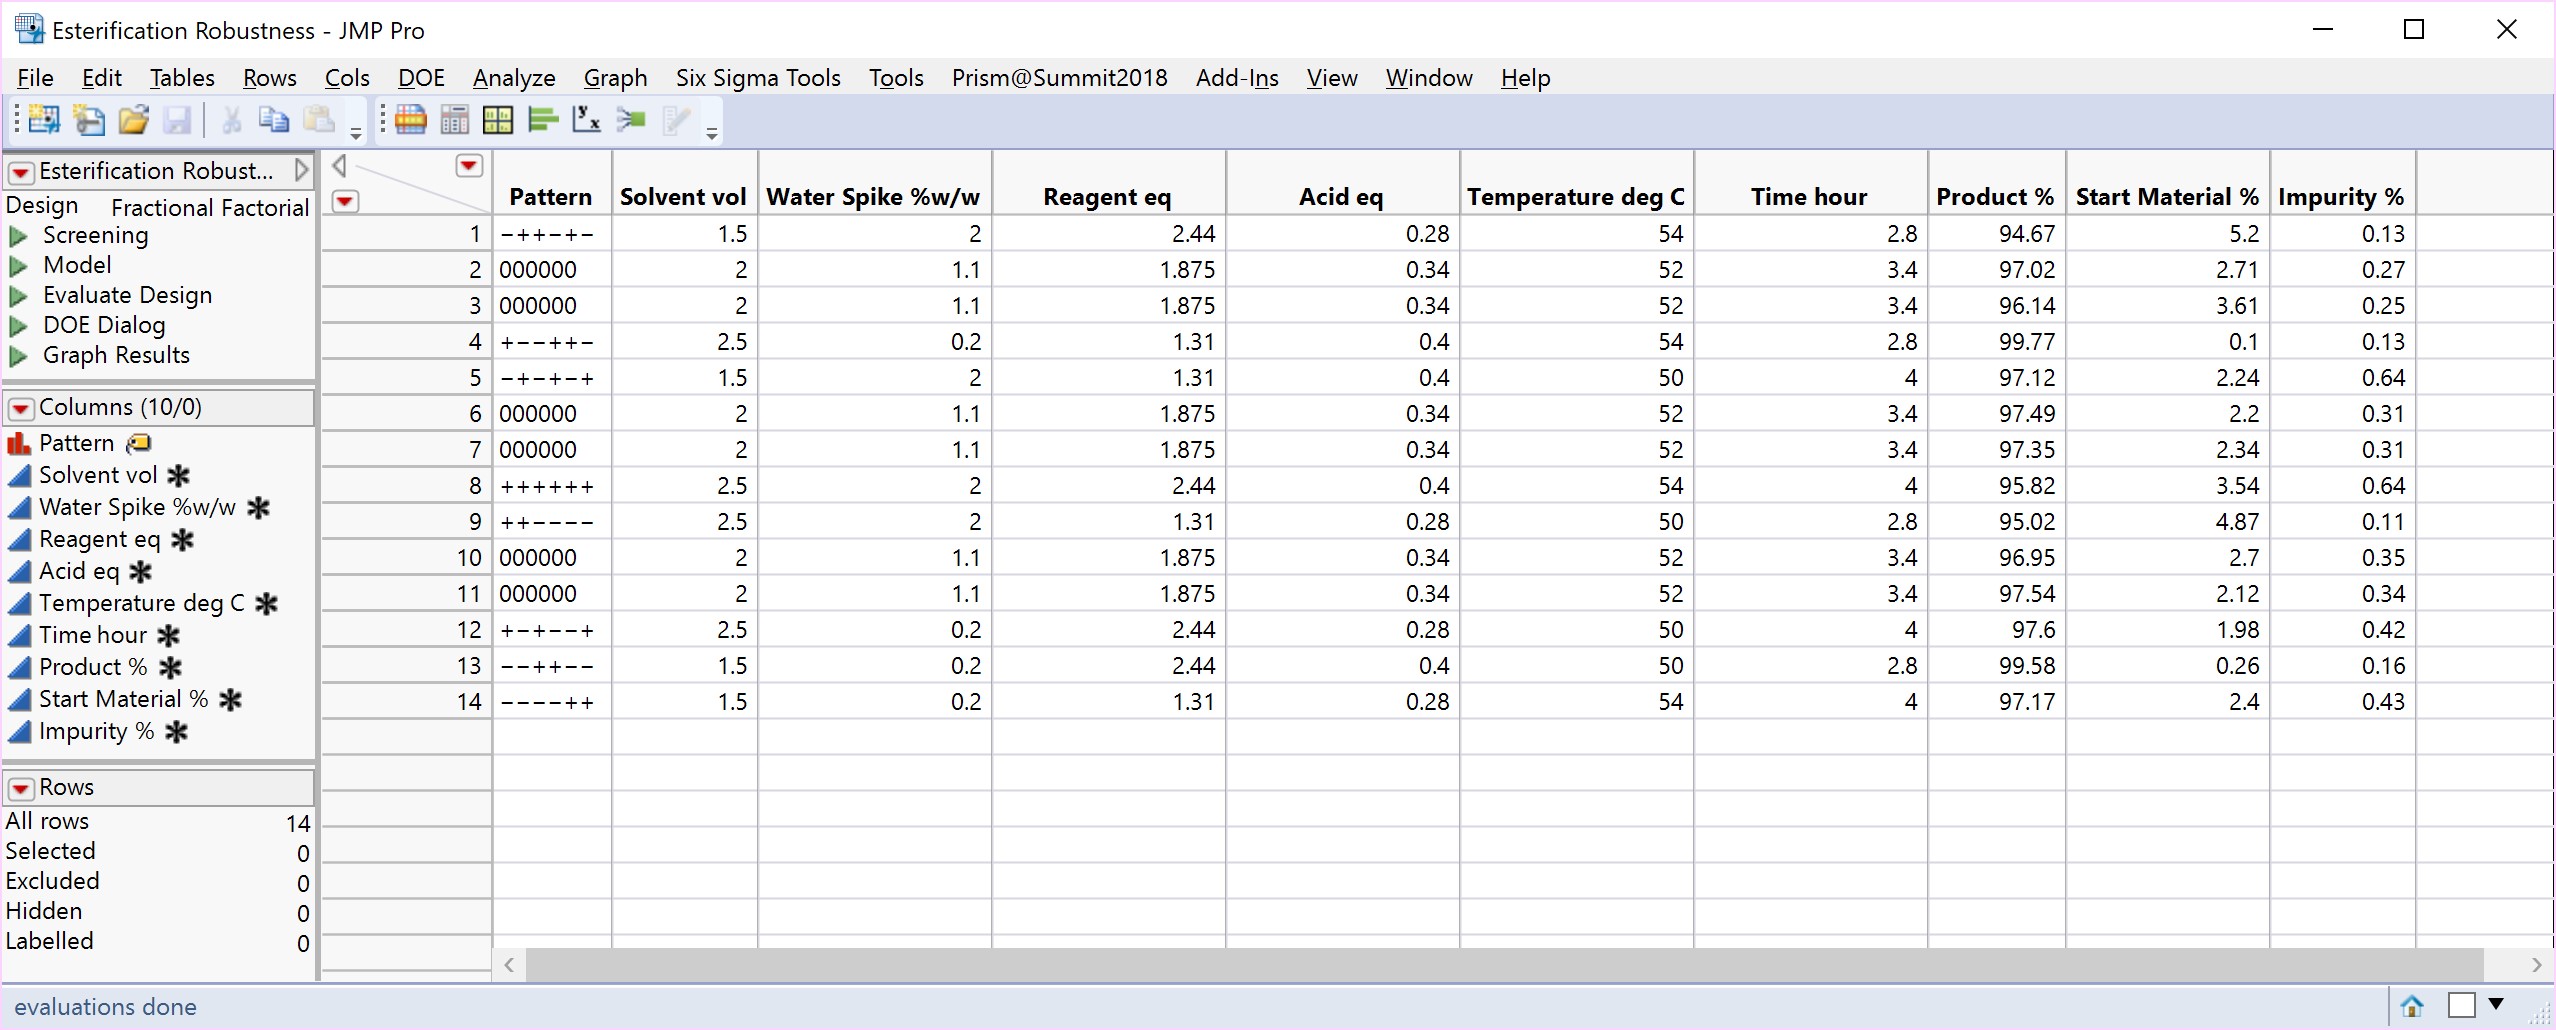
A Screening Study, with 20 experiments and all six process parameters studied at their low and high settings or levels. The most commonly used 2-level screening designs are the power of 2 full or fractional factorial designs. These comprise all or a carefully chosen fraction of all possible combinations of the low and high settings respectively. The goal of these studies is to screen the vital few potentially critical parameters affecting the process and, if resource permits it, establish dependent relationships between any pair of parameters and the direction of their effects to steer the process toward a robust optimum.
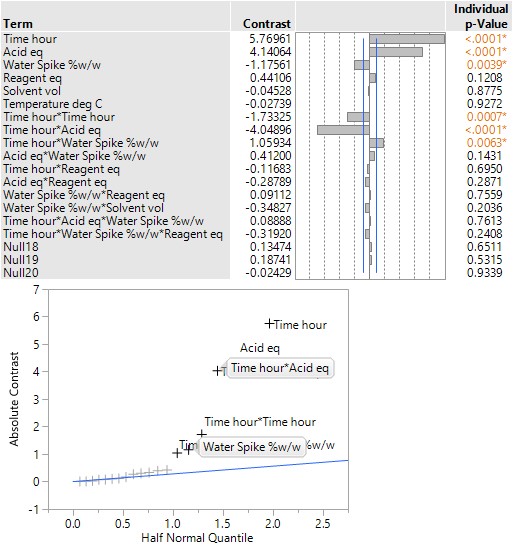
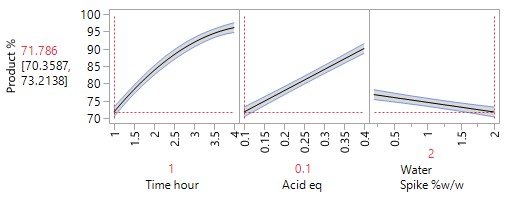
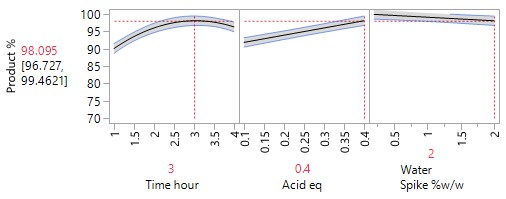
The table and plot of the effects below establish that reaction time and the acid, together with their interaction, have the greatest effect on conversion. The profiles (bottom right) show that combinations of lower acid equivalents and shorter reaction times cause the yields to drop by 30% and make the reaction sensitive to a higher water spike. At the higher equivalents for acid and longer reaction time the yields are stable, and the process can tolerate up to 2% w/w of water (i.e., drying times can be reduced, throughput can be increased and costs reduced).
An Optimisation or Response Surface (RSM) Study, including 6-10 experiments in a second block augmenting the existing screening study, but carrying forward only the 2-3 parameters surviving the screening exercise (e.g., Acid and Time). The non-critical parameters in the meantime are fixed at practical, convenient or cost-effective settings. The full RSM model for six parameters would otherwise have 28 terms: 1 intercept, 6 main linear effects, 6 quadratic terms and 15 two-factor interaction (2FI) terms. The minimum number of runs required to estimate this model is 28. Extra runs would be needed to provide an estimate for the error term. The experimenter would rightly consider a further 30 runs too costly. The proposed sequential approach is more sensible.
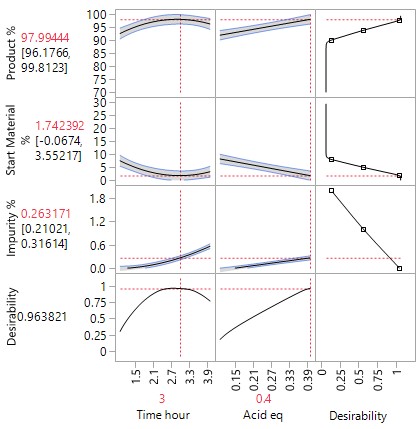
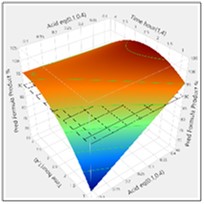
The more detailed study of the critical process parameters provides an improved predictive model in a region where the optimum is expected to exist. The profiles, surface and contour plots below establish settings and ranges for the parameters, where the process is now predicted to meet the acceptance criteria for the multiple attributes, simultaneously. The most desirable solution or sweet spot, as well as operating ranges, can be located and risk assessed via simulation. More importantly, confirmation is given as to the conditions under which the yields will drop – the cliff edge also happens to be the original set-point – and then fall by 30% due to too low acid equivalents and short reaction times.
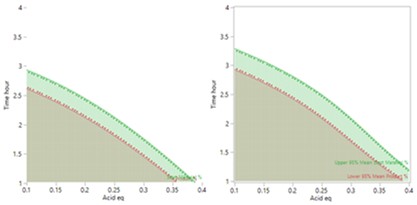
New risk assessed and predicted acceptable plant operating ranges are proposed, which can be validated using…
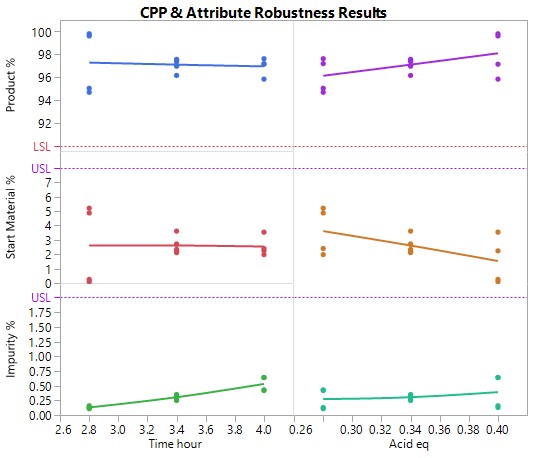
A Robustness Study, using the minimal resource (e.g., 10 experiments), but involving all 6 factors to confirm or prove the operating ranges, predicted to be acceptable following optimisation, would indeed result in acceptable product meeting the predefined criteria for all attributes under worst case conditions. These proven acceptable ranges (PARs) define the design space for the process at the end of the development phase. No practically significant effects are expected nor wanted. The data generated by the robustness study enhances confidence that even under worst case conditions, the process does not generate any out of specification results.
The graph of the results show that reproducibly high yields are achievable and that data driven boundary conditions have been established. A future control strategy should be put in place to ensure the CPPs Acid and Rx Time are controlled to fall within the established proven acceptable ranges (PARs).
References
Mahalanobis, P. (1938). The First Session of the Indian Statistical Conference, Calcutta, 1938. Sankhyā: The Indian Journal of Statistics (1933-1960), 4(1), 1-4.
This is the first part of a series of blogs exploring the Practical (Real-life) Implementation of Sequential Design of Experiments and the Introduction of Definitive Screening Designs. The series continues with The Evolution of Definitive Screening Designs from Optimal (Custom) Design of Experiments, and finally Strategies to Combat Problems Employing DSDs.
For more information about how Prism Training & Consultancy can assist you with statistical support, please click here to learn more about our services.
Be the first to know about new blogs, upcoming courses, events, news and offers by joining our mailing list here.